MiLB Sees Attendance Increase In 2019, Reversing Last Year’s Drop

Image credit: Jeff Speer/Icon Sportswire via Getty Images)
For Minor League Baseball’s attendance, 2019 was a very good year.
A year after MiLB posted its smallest total attendance in 14 seasons, MiLB attendance was up 2.6 percent in 2019. MiLB reported that 41,504,077 fans passed through the turnstiles in 2019, an increase of 2.6 percent from last season’s 40,450,337 fans.
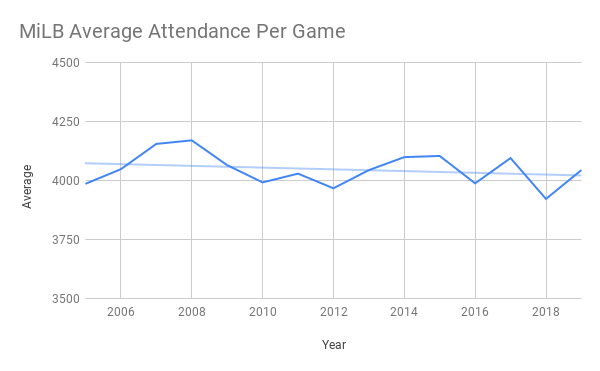
What the numbers appear to show was that last year’s attendance drop was not a sign of a developing trend. While MiLB’s record attendance of 43.2 million, set in 2008, seems far out of reach right now, MiLB has found a solid equilibrium. This was the 14 consecutive season that MiLB has drawn more than 40 million fans, and its average of 4,044 fans per game is slightly above its average attendance per game for the past decade.
Whether the 2019 season is viewed as a jump (from 2018) or a return to normalcy (when compared to the rest of the decade), MiLB can confidently state that their attendance is bucking current trends.
“We are one, if not the only sports property experiencing an increase in attendance. That has not been the trend in pro sports in this country,” MiLB President Pat O’Conner said.
Last year’s NFL attendance (17.2 million) was the league’s worst total attendance since 2010. The NBA in 2018-2019 saw fewer fans (22 million) cross through the gates than any year since 2015. And MLB’s attendance last year (69.7 million) was its worst since 2003. (The NHL does not officially release attendance information).
“Our attendance numbers, while they may fluctuate, they have been fairly stable,” O’Conner said. “You can count in a shaded area between 40 and 41.5 million and we’re likely to land in that spot.”
MiLB saw significant success with its Copa de la Diversion initiative, in which teams created events to honor the local Latino community, and Pride events aimed at honoring the LGBTQ community.
According to MiLB, Copa games, when the minor league teams adopted Spanish-language names and identities, drew crowds 20 percent above average attendance, while MiLB Pride events drew crowds 12 percent larger than normal.
“The idea is to diversify our crowds and include these diverse groups in our overall family,” O’Conner said. “At least anecdotally . . . the fact we’ve started these, they’ve been wildly successful and they have been very well received.
“We’re going to see the day-over-day, year-over-year results of these efforts. We’re going to see the long-term effects of inclusion.”
Around the minors, the arrival of new teams and new ballparks made a massive difference. New ballparks in Amarillo, Fayetteville and especially Las Vegas made an impact.
The new ballpark in Las Vegas was a massive success. The Aviators drew 318,710 more fans than the Las Vegas 51s did in 2018 in the team’s old ballpark. Las Vegas averaged 9,299 fans per game, which was the highest average attendance any U.S. team in the minor leagues has seen since Charlotte drew 9,428 fans per game in 2015.
Similarly, Fayetteville drew nearly 223,000 more fans than Buies Creek drew in 2018, and Amarillo drew 165,000 more fans than Colorado Springs did in 2018.
The Rocky Mountain Vibes, which replaced the Helena Brewers, drew 106,208 more fans than Helena did a season ago. Rocky Mountain’s average per game attendance (3,923 per game) was nearly 2,000 more fans than Helena drew for its biggest draw of the 2018 season.
Removing teams who moved into newer, bigger stadiums, this season’s biggest winner was the Syracuse Mets.
Purchased by the Mets from the Nationals before the 2018 season, Syracuse added 50,146 fans through the gates at NBT Bank Stadium. Unsurprisingly, the team’s average number of fans per game also grew. The Mets averaged 4,962 fans per game in 2019, an increase of 760 fans per game from the previous season. Syracuse lost four openings to weather in both seasons, but it gained one of those games back this year thanks to the one-game playoff the Mets forced to determine the winner of the International League’s North Division title.
Of course, while the Mets did not have a new stadium on their side, they did have the minors’ biggest ace in the hole over the past few years: Tim Tebow. The former NFL quarterback-turned minor leaguer spent the entire season with Syracuse until injury ended his season in July. Before that, Tebow did what he always does: strikes out and increases his team’s attendance figures.
Syracuse’s attendance topped the 300,000 mark for the first time since 2013, but still finished 13th overall in the International League. Beyond the presence of Tebow, Syracuse’s bump in attendance can also be attributed to the team’s first year playing as a Mets affiliate in New York.
The Tebow factor was even bigger on the road, however, where Syracuse drew an International League-best 528,101 fans. That number bested their 2018 total by more than 73,000 fans or an average of 962 more fans per game at parks around the IL.
The Mets’ opponent in that one-game playoff, the Scranton/Wilkes-Barre RailRiders, finished second in overall attendance change in 2019, adding 28,072 fans to the seats at PNC Field. They, of course, also had the benefit of an extra game, and they also lost one fewer game to weather than they did in 2018.
On the other side of the spectrum, there are the New Orleans Baby Cakes, who will be moving to Wichita, Kan. at some point in the near future (though exactly when is still cloudy). They saw the most precipitous drop in attendance among teams not dealing with stadium issues. The Baby Cakes drew just 188,092 fans to the Shrine on Airline in 2019, a drop of 64,522 fans from its mark in 2018. Their average attendance dropped sharply as well, falling by 888 fans per game year over year.
Teams who will soon be vacating their current cities accounted for three of the bottom four spots on this year’s attendance ledger.
The Pawtucket Red Sox, who are moving to Worcester, Mass., after next season, finished third from the bottom and saw a total decrease of 63,801 fans and an average decrease of 728 fans at McCoy Stadium. Coming in just behind Pawtucket are the Potomac Nationals, who will be moving to Fredericksburg, Va., starting next season. They saw their attendance fall by 44,770 with an average drop of 504 fans per game. The caveat here is that they also had 11 lost openings this year, four more than in 2018.
The P-Nats were one of seven teams with 10 or more openings lost this year. Unsurprisingly, four of those clubs (Fort Myers, Palm Beach, Dunedin, Florida) were in the Florida State League, which cancelled its entire schedule on the final two days of the season to give clubs time to prepare for Hurricane Dorian.
It was a disappointing year in the Florida State League, in general. The early end to the season because of Hurricane Dorian didn’t help, but this was the first year the FSL failed to top two million fans since 2005. Five different FSL clubs failed to average 1,000 fans per night, with two (Dunedin, which is opening a renovated stadium in 2020, and Florida) averaging less than 400 fans per game.
High Class A Frederick (Carolina League) and Double-A Mobile (Southern League)—the latter of which will be moving to Madison, Ala., next season and rebranding as the Rocket City Trash Pandas—also lost more than 10 games this season to weather.
On the other side of the coin, there were 16 teams across the entire minor leagues that finished the year without an opening lost to weather or other circumstances: Triple-A Round Rock, Double-A Corpus Christi, Triple-A Reno, Double-A Birmingham, low Class A Lansing, Rookie-level Pulaski, Triple-A Sacramento, Rookie-level Elizabethton, Triple-A Louisville, Triple-A Las Vegas and the entire short-season Northwest League.
In terms of consistency, the Hudson Valley Renegades and Portland Sea Dogs reign supreme. Hudson Valley, which plays in the short-season New York-Penn League, drew two more fans this year than in 2018. Portland averaged one less fan per game through the gates at Hadlock Field year over year.
| Team | 2019 Total | Openings | Average |
Per Game
Change
|
| *Las Vegas Aviators | 650,934 | 70 | 9,299 | 4,553 |
| *Fayetteville Woodpeckers | 246,961 | 68 | 3,632 | 3,273 |
| *Rocky Mountain Vibes | 137,294 | 35 | 3,923 | 3,083 |
| *Amarillo Sod Poodles | 427,791 | 68 | 6,291 | 2,187 |
| Syracuse Mets | 327,478 | 66 | 4,962 | 760 |
| Ogden Raptors | 146,201 | 37 | 3,951 | 549 |
| Mobile BayBears | 95,087 | 60 | 1,585 | 464 |
| Batavia Muckdogs | 43,118 | 37 | 1,165 | 381 |
| Midland RockHounds | 285,368 | 68 | 4,197 | 329 |
| Chattanooga Lookouts | 228,662 | 65 | 3,518 | 312 |
| Rochester Red Wings | 451,853 | 66 | 6,846 | 309 |
| Johnson City Cardinals | 80,612 | 32 | 2,519 | 297 |
| Elizabethton Twins | 27,569 | 34 | 811 | 282 |
| Tulsa Drillers | 374,501 | 68 | 5,507 | 277 |
| Louisville Bats | 485,356 | 70 | 6,934 | 276 |
| Scranton/Wilkes-Barre RailRiders | 414,891 | 65 | 6,383 | 243 |
| Bowling Green Hot Rods | 190,877 | 65 | 2,937 | 235 |
| Reading Fightin Phils | 398,314 | 67 | 5,945 | 232 |
| Salem-Keizer Volcanoes | 80,833 | 38 | 2,127 | 230 |
| Mississippi Braves | 163,841 | 66 | 2,482 | 223 |
| Trenton Thunder | 340,705 | 65 | 5,242 | 223 |
| San Jose Giants | 155,253 | 67 | 2,317 | 207 |
| Burlington Bees | 67,369 | 64 | 1,053 | 194 |
| Hickory Crawdads | 137,546 | 66 | 2,084 | 184 |
| Hartford Yard Goats | 414,946 | 67 | 6,193 | 179 |
| Iowa Cubs | 489,173 | 65 | 7,526 | 170 |
| Grand Junction Rockies | 88,476 | 37 | 2,391 | 170 |
| Delmarva Shorebirds | 218,704 | 67 | 3,264 | 167 |
| Beloit Snappers | 73,200 | 62 | 1,181 | 156 |
| Eugene Emeralds | 131,467 | 38 | 3,460 | 145 |
| Everett AquaSox | 116,630 | 38 | 3,069 | 132 |
| Visalia Rawhide | 129,118 | 68 | 1,899 | 125 |
| Lancaster JetHawks | 161,595 | 69 | 2,342 | 120 |
| Hudson Valley Renegades | 148,158 | 36 | 4,116 | 112 |
| Erie SeaWolves | 215,444 | 65 | 3,315 | 111 |
| Gwinnett Stripers | 212,342 | 67 | 3,169 | 107 |
| Carolina Mudcats | 193,568 | 68 | 2,847 | 103 |
| Jackson Generals | 107,131 | 61 | 1,756 | 102 |
| Boise Hawks | 129,805 | 38 | 3,416 | 95 |
| Frederick Keys | 263,528 | 60 | 4,392 | 95 |
| Lehigh Valley IronPigs | 585,110 | 68 | 8,605 | 94 |
| Hillsboro Hops | 133,605 | 38 | 3,516 | 87 |
| Akron RubberDucks | 340,187 | 67 | 5,077 | 81 |
| Lynchburg Hillcats | 117,029 | 63 | 1,858 | 77 |
| Arkansas Travelers | 311,021 | 68 | 4,574 | 76 |
| Burlington Royals | 40,142 | 33 | 1,216 | 74 |
| Daytona Tortugas | 137,570 | 65 | 2,116 | 70 |
| Fort Myers Miracle | 108,800 | 57 | 1,909 | 60 |
| Pulaski Yankees | 95,897 | 34 | 2,821 | 57 |
| Richmond Flying Squirrels | 400,321 | 64 | 6,255 | 57 |
| Columbus Clippers | 590,504 | 68 | 8,684 | 51 |
| Myrtle Beach Pelicans | 226,247 | 67 | 3,377 | 50 |
| Spokane Indians | 200,273 | 38 | 5,270 | 48 |
| Mahoning Valley Scrappers | 98,833 | 36 | 2,745 | 45 |
| Williamsport Crosscutters | 64,148 | 33 | 1,944 | 42 |
| Sacramento River Cats | 549,440 | 70 | 7,849 | 41 |
| Idaho Falls Chukars | 102,859 | 37 | 2,780 | 38 |
| Vermont Lake Monsters | 83,122 | 37 | 2,247 | 38 |
| Albuquerque Isotopes | 542,832 | 68 | 7,983 | 35 |
| Altoona Curve | 308,464 | 67 | 4,604 | 33 |
| Dayton Dragons | 545,108 | 69 | 7,900 | 32 |
| Bluefield Blue Jays | 20,909 | 31 | 674 | 28 |
| Lake County Captains | 200,756 | 65 | 3,089 | 27 |
| Greenville Drive | 329,733 | 68 | 4,849 | 26 |
| Clinton LumberKings | 121,325 | 66 | 1,838 | 22 |
| Kannapolis Intimidators | 75,931 | 67 | 1,133 | 18 |
| Clearwater Threshers | 180,069 | 67 | 2,688 | 16 |
| Lakewood BlueClaws | 308,318 | 66 | 4,671 | 14 |
| Durham Bulls | 529,105 | 69 | 7,668 | 7 |
| San Antonio Missions | 337,484 | 69 | 4,891 | 6 |
| Pensacola Blue Wahoos | 296,095 | 68 | 4,354 | 6 |
| Portland Sea Dogs | 357,647 | 63 | 5,677 | -1 |
| Kingsport Mets | 29,553 | 33 | 896 | -8 |
| Great Falls Voyagers | 47,207 | 34 | 1,388 | -13 |
| Jupiter Hammerheads | 62,684 | 60 | 1,045 | -18 |
| Lakeland Flying Tigers | 50,770 | 62 | 819 | -21 |
| State College Spikes | 119,120 | 37 | 3,219 | -24 |
| Princeton Rays | 24,133 | 33 | 731 | -26 |
| Norfolk Tides | 350,086 | 66 | 5,304 | -30 |
| Columbia Fireflies | 245,522 | 66 | 3,720 | -35 |
| Great Lakes Loons | 195,904 | 69 | 2,839 | -41 |
| Memphis Redbirds | 327,753 | 66 | 4,966 | -41 |
| Tri-City Dust Devils | 87,021 | 38 | 2,290 | -42 |
| Auburn Doubledays | 39,381 | 34 | 1,158 | -46 |
| Modesto Nuts | 139,762 | 69 | 2,026 | -46 |
| Billings Mustangs | 96,594 | 37 | 2,611 | -59 |
| Palm Beach Cardinals | 57,418 | 59 | 973 | -59 |
| Bradenton Marauders | 71,284 | 63 | 1,131 | -61 |
| Rome Braves | 152,874 | 69 | 2,216 | -70 |
| Rancho Cucamonga Quakes | 162,085 | 68 | 2,384 | -70 |
| Jacksonville Jumbo Shrimp | 327,388 | 66 | 4,960 | -77 |
| Asheville Tourists | 187,718 | 68 | 2,761 | -79 |
| Vancouver Canadians | 235,980 | 38 | 6,210 | -82 |
| Frisco RoughRiders | 455,765 | 67 | 6,802 | -84 |
| Oklahoma City Dodgers | 444,131 | 67 | 6,629 | -84 |
| West Virginia Power | 118,444 | 68 | 1,742 | -99 |
| Biloxi Shuckers | 146,845 | 63 | 2,331 | -99 |
| Nashville Sounds | 578,291 | 67 | 8,631 | -110 |
| Wilmington Blue Rocks | 231,325 | 62 | 3,731 | -111 |
| Cedar Rapids Kernels | 150,278 | 67 | 2,243 | -112 |
| Springfield Cardinals | 328,217 | 69 | 4,757 | -114 |
| Orem Owlz | 45,561 | 37 | 1,231 | -114 |
| Charleston RiverDogs | 301,320 | 69 | 4,367 | -119 |
| Down East Wood Ducks | 110,619 | 67 | 1,651 | -119 |
| Wisconsin Timber Rattlers | 218,037 | 65 | 3,354 | -121 |
| Bristol Pirates | 18,750 | 32 | 586 | -122 |
| Stockton Ports | 179,465 | 69 | 2,601 | -123 |
| Harrisburg Senators | 258,909 | 67 | 3,864 | -124 |
| West Virginia Black Bears | 62,846 | 37 | 1,699 | -128 |
| Augusta GreenJackets | 266,569 | 68 | 3,920 | -130 |
| Tampa Tarpons | 61,290 | 63 | 973 | -132 |
| South Bend Cubs | 319,616 | 67 | 4,770 | -141 |
| Inland Empire 66ers | 181,253 | 69 | 2,627 | -144 |
| Danville Braves | 30,007 | 33 | 909 | -145 |
| Connecticut Tigers | 66,532 | 35 | 1,901 | -148 |
| Fort Wayne TinCaps | 371,259 | 67 | 5,541 | -162 |
| Northwest Arkansas Naturals | 284,829 | 66 | 4,316 | -162 |
| Winston-Salem Dash | 264,879 | 62 | 4,272 | -164 |
| Lansing Lugnuts | 311,028 | 70 | 4,443 | -169 |
| Greensboro Grasshoppers | 306,136 | 65 | 4,710 | -171 |
| Toledo Mud Hens | 481,496 | 67 | 7,187 | -175 |
| Bowie Baysox | 224,686 | 69 | 3,256 | -182 |
| Missoula Osprey | 57,076 | 34 | 1,679 | -204 |
| Indianapolis Indians | 586,860 | 68 | 8,630 | -215 |
| Reno Aces | 336,215 | 70 | 4,803 | -216 |
| Montgomery Biscuits | 216,839 | 68 | 3,189 | -219 |
| Greeneville Reds | 43,617 | 33 | 1,322 | -227 |
| St. Lucie Mets | 82,581 | 64 | 1,290 | -230 |
| Staten Island Yankees | 66,520 | 36 | 1,848 | -235 |
| Peoria Chiefs | 198,545 | 68 | 2,920 | -236 |
| Kane County Cougars | 350,305 | 67 | 5,228 | -241 |
| El Paso Chihuahuas | 522,894 | 69 | 7,578 | -241 |
| Hagerstown Suns | 59,682 | 65 | 918 | -242 |
| Corpus Christi Hooks | 323,688 | 70 | 4,624 | -242 |
| Dunedin Blue Jays | 11,757 | 58 | 203 | -247 |
| Tri-City ValleyCats | 131,529 | 34 | 3,869 | -250 |
| Salt Lake Bees | 433,596 | 65 | 6,671 | -250 |
| Round Rock Express | 597,928 | 70 | 8,542 | -267 |
| Buffalo Bisons | 518,741 | 65 | 7,981 | -269 |
| Florida Fire Frogs | 19,615 | 60 | 327 | -273 |
| Aberdeen IronBirds | 118,357 | 37 | 3,199 | -284 |
| Charlotte Stone Crabs | 91,349 | 67 | 1,363 | -291 |
| Fresno Grizzlies | 380,090 | 66 | 5,759 | -292 |
| Tacoma Rainiers | 347,378 | 68 | 5,109 | -294 |
| Birmingham Barons | 379,707 | 70 | 5,424 | -327 |
| Lowell Spinners | 100,687 | 33 | 3,051 | -330 |
| Omaha Storm Chasers | 328,307 | 66 | 4,974 | -346 |
| New Hampshire Fisher Cats | 306,511 | 65 | 4,716 | -349 |
| Tennessee Smokies | 280,708 | 65 | 4,319 | -349 |
| Salem Red Sox | 171,866 | 67 | 2,565 | -354 |
| Lexington Legends | 270,221 | 66 | 4,094 | -368 |
| West Michigan Whitecaps | 360,295 | 67 | 5,378 | -392 |
| Charlotte Knights | 581,006 | 68 | 8,544 | -436 |
| Brooklyn Cyclones | 174,522 | 36 | 4,848 | -481 |
| Potomac Nationals | 192,474 | 59 | 3,262 | -504 |
| Lake Elsinore Storm | 172,280 | 68 | 2,534 | -537 |
| Binghamton Rumble Ponies | 182,990 | 61 | 3,000 | -553 |
| Quad Cities River Bandits | 150,905 | 61 | 2,474 | -689 |
| Pawtucket Red Sox | 331,010 | 63 | 5,254 | -728 |
| New Orleans Baby Cakes | 188,092 | 64 | 2,939 | -888 |
| *Changed Stadium/City |

Comments are closed.